About Testlum
Getting Started
UI Testing
Api Testing
Database Testing
Services Testing
Additional Materials
Powered By
Testlum has informative and easy to read logs.
Each tag has a unique display structure in the logs, due to the individual approach and visualization of tags in the logs.
Uniqueness of logs:
- Ease of perception
- Table structure
- Step by step analysis of the execution of each step of the scenario
- Detailed analysis of the execution of each tag
- Informative output of exceptions
- Displaying the overall result of passing scenarios
WEB Log's Structure
An example of tags display:
<click>
<wait>
<input>
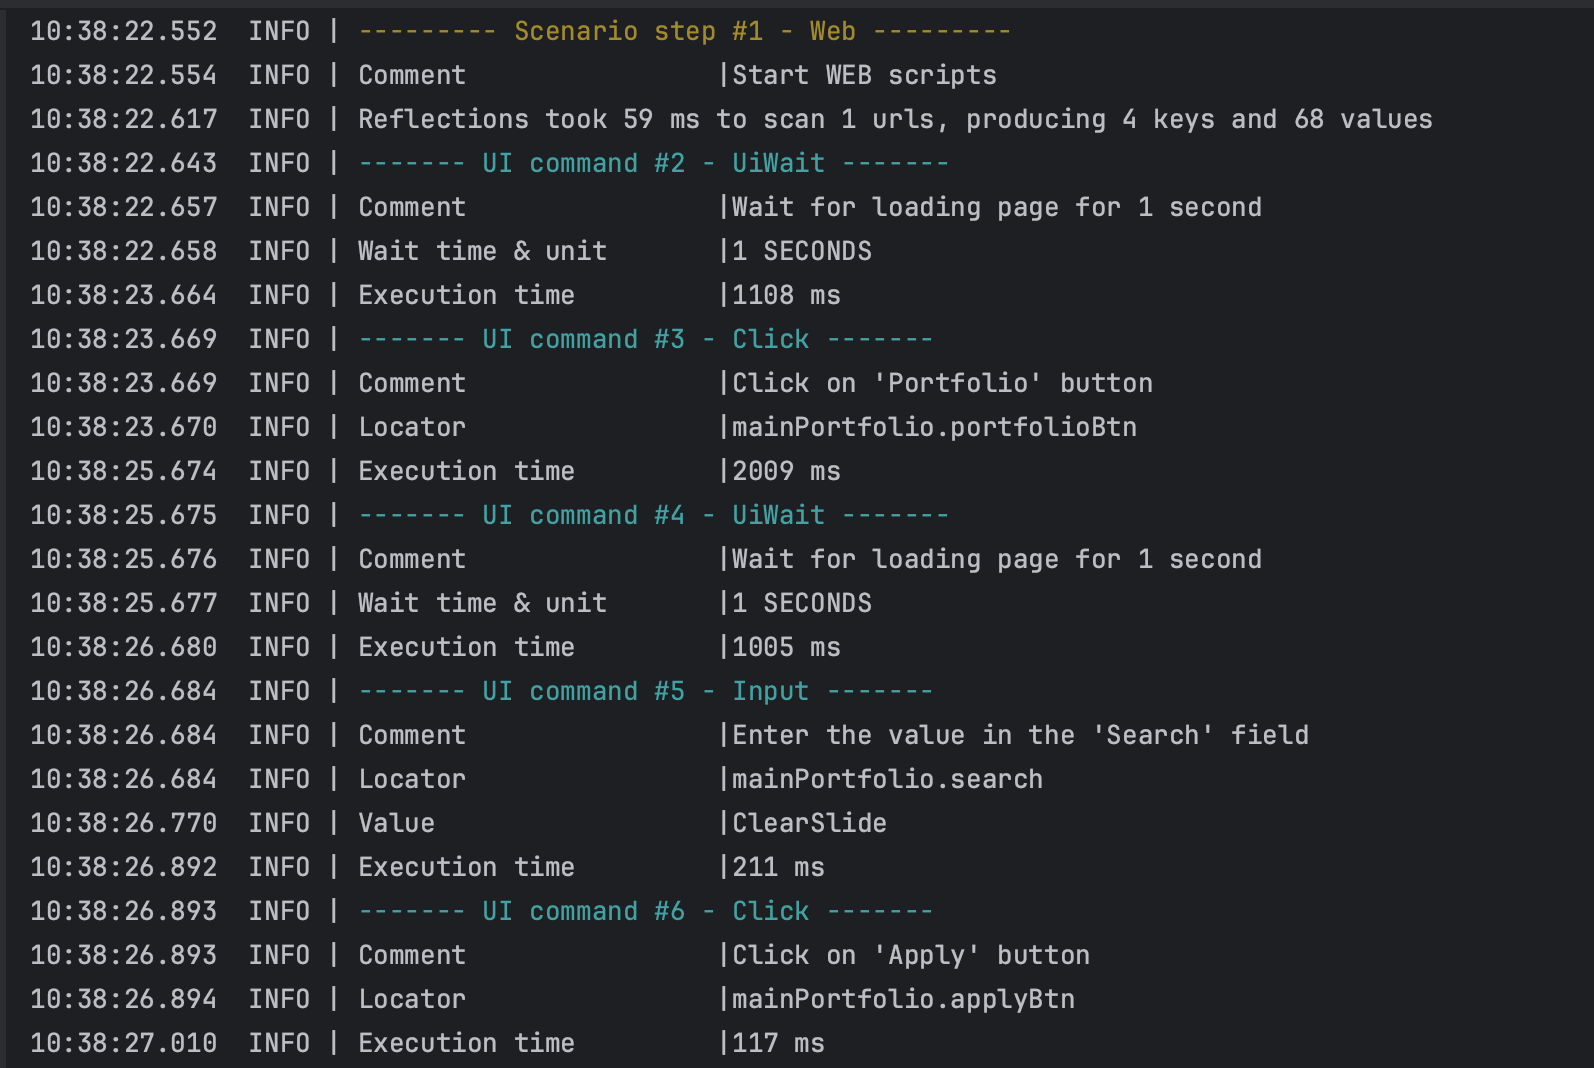
In these logs, we can see all the specific steps in passing our test scenarios, with a display of the transmitted and used data.
In the <click> command we see:
- Comment - a unique parameter for each tag that describes the action of the step.
- Locator - passed WEB interaction element, with folder name, and unique element name.
- Execution time - a unique value for each tag that prints the execution time of each command.
In the <wait> command we see:
- Comment - a unique parameter for each tag that describes the action of the step.
- wait time & unit - a time for which the scenario pauses the passage of the scenario to perform a certain function that requires a wait.
- Execution time - a unique value for each tag that prints the execution time of each command.
In the <input> command we see:
- Comment - a unique parameter for each tag that describes the action of the step.
- Locator - passed WEB interaction element, with folder name, and unique element name.
- Value - output of the passed value.
- Execution time - a unique value for each tag that prints the execution time of each command.
This structure allows you to quickly find errors in the test scenarios, and see the display of high-quality logs.
HTTP Log's Structure
An example of displaying a <http> request:

In the <http> command we see:
Comment- a unique parameter for each tag that describes the action of the step.Alias- the unique name of the API we are interacting with.Method- display of thehttpmethod used.Endpoint- used endpoint.Body- display of the transmitted request body.Status code- API response code.Execution time- a unique value for each tag that prints the execution time of each command.
DB Log's Structure
An example of displaying a <postgres> request:
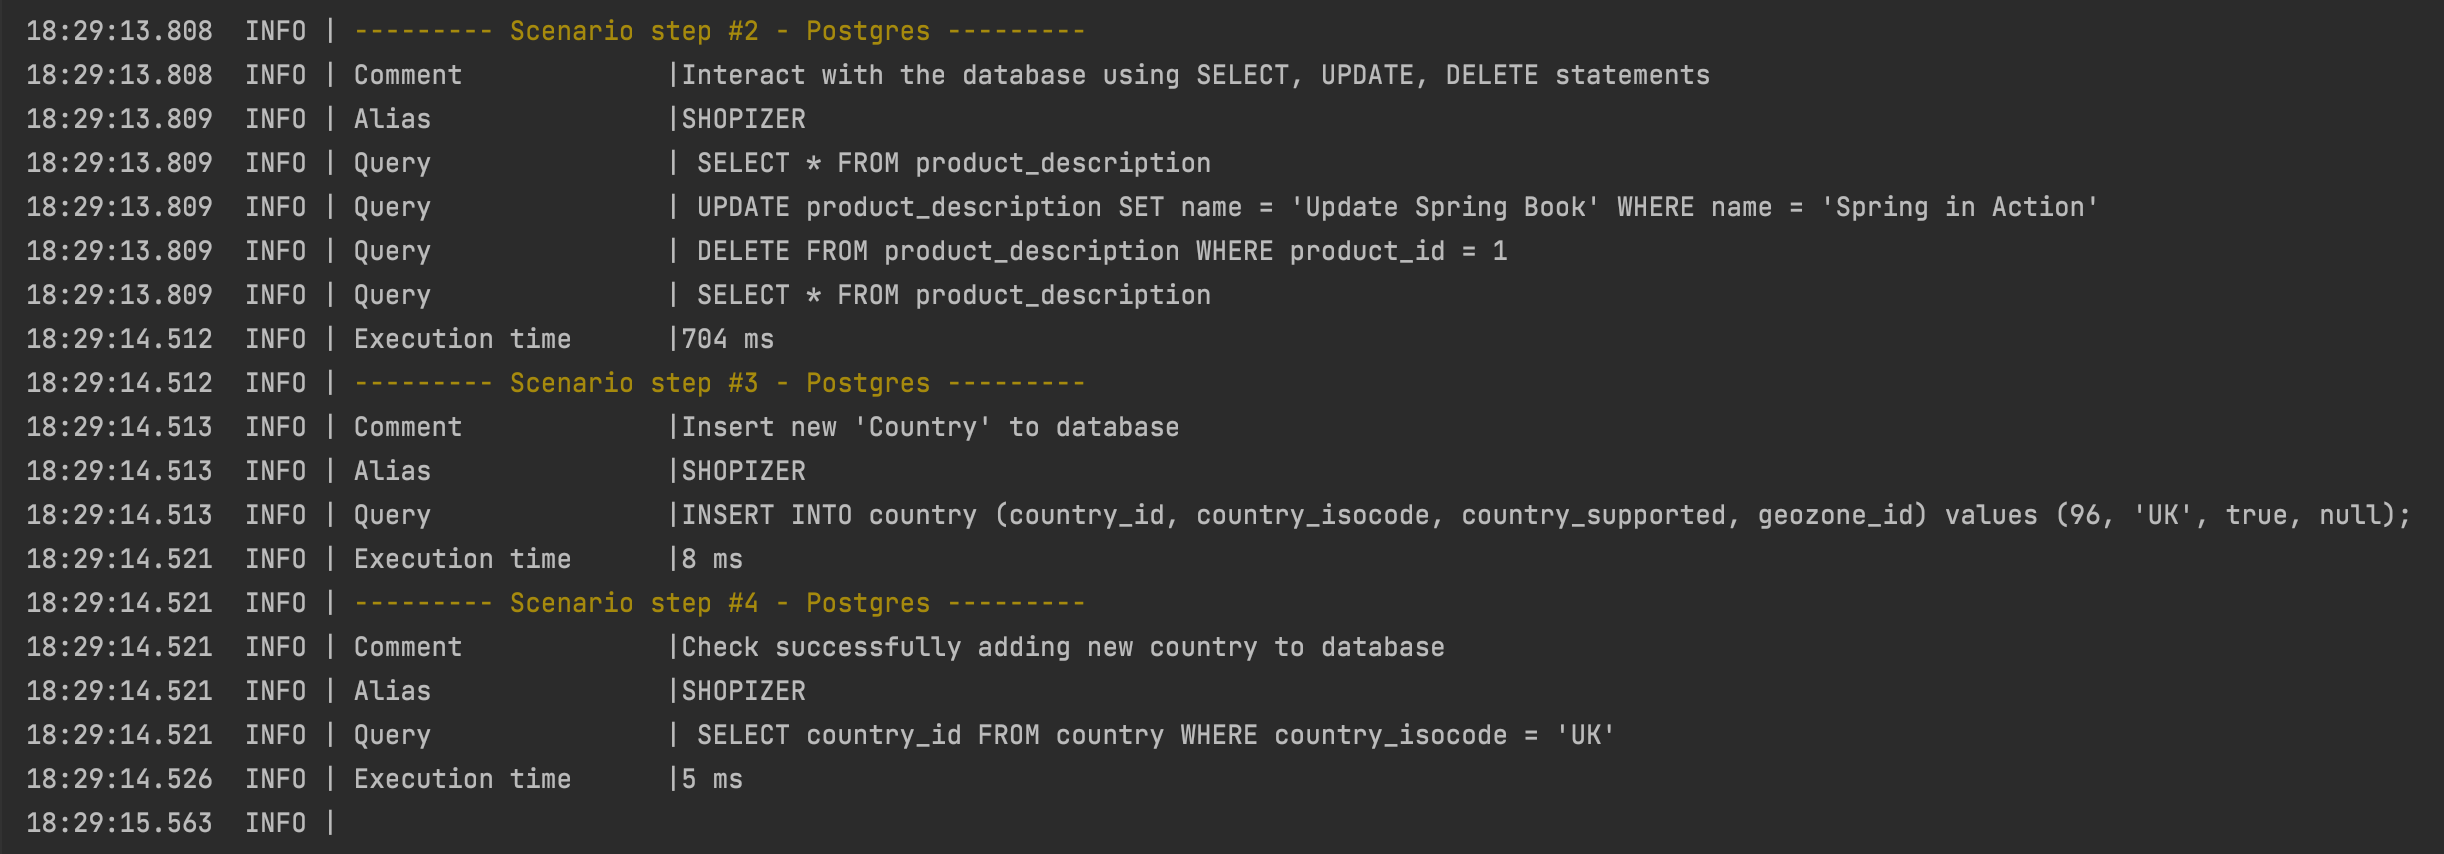
In the <postgres> command we see:
Comment- a unique parameter for each tag that describes the action of the step.Alias- unique alias of the database we are interacting with.Query- database queries.Execution time- a unique value for each tag that prints the execution time of each command.